Recommendations of the Committee on the Rights of the Child
On Advancing Child Rights in Europe and Central Asia
The Committee on the Rights of the Child is the UN body of independent experts responsible for monitoring the implementation of the Convention of the Rights of the Child (CRC) and its Optional Protocols. In the ambit of this process, the Committee examines periodic reports prepared by governments and independent stakeholders from each State party and engages in constructive dialogue with them to obtain an accurate assessment of the situation of children. The Committee indicates the progress achieved, addresses its concerns and provides corresponding recommendations to the State parties through the adoption of country-specific Concluding Observations.
This interactive dashboard brings together the Committee’s most recent recommendations to 54 State parties in the Europe and Central Asia (ECA) region, including both the UNICEF programme and non-programme countries. The recommendations are further broken down into specific actions, presented under various categories in line with specific child rights issues.
How to use this dashboard
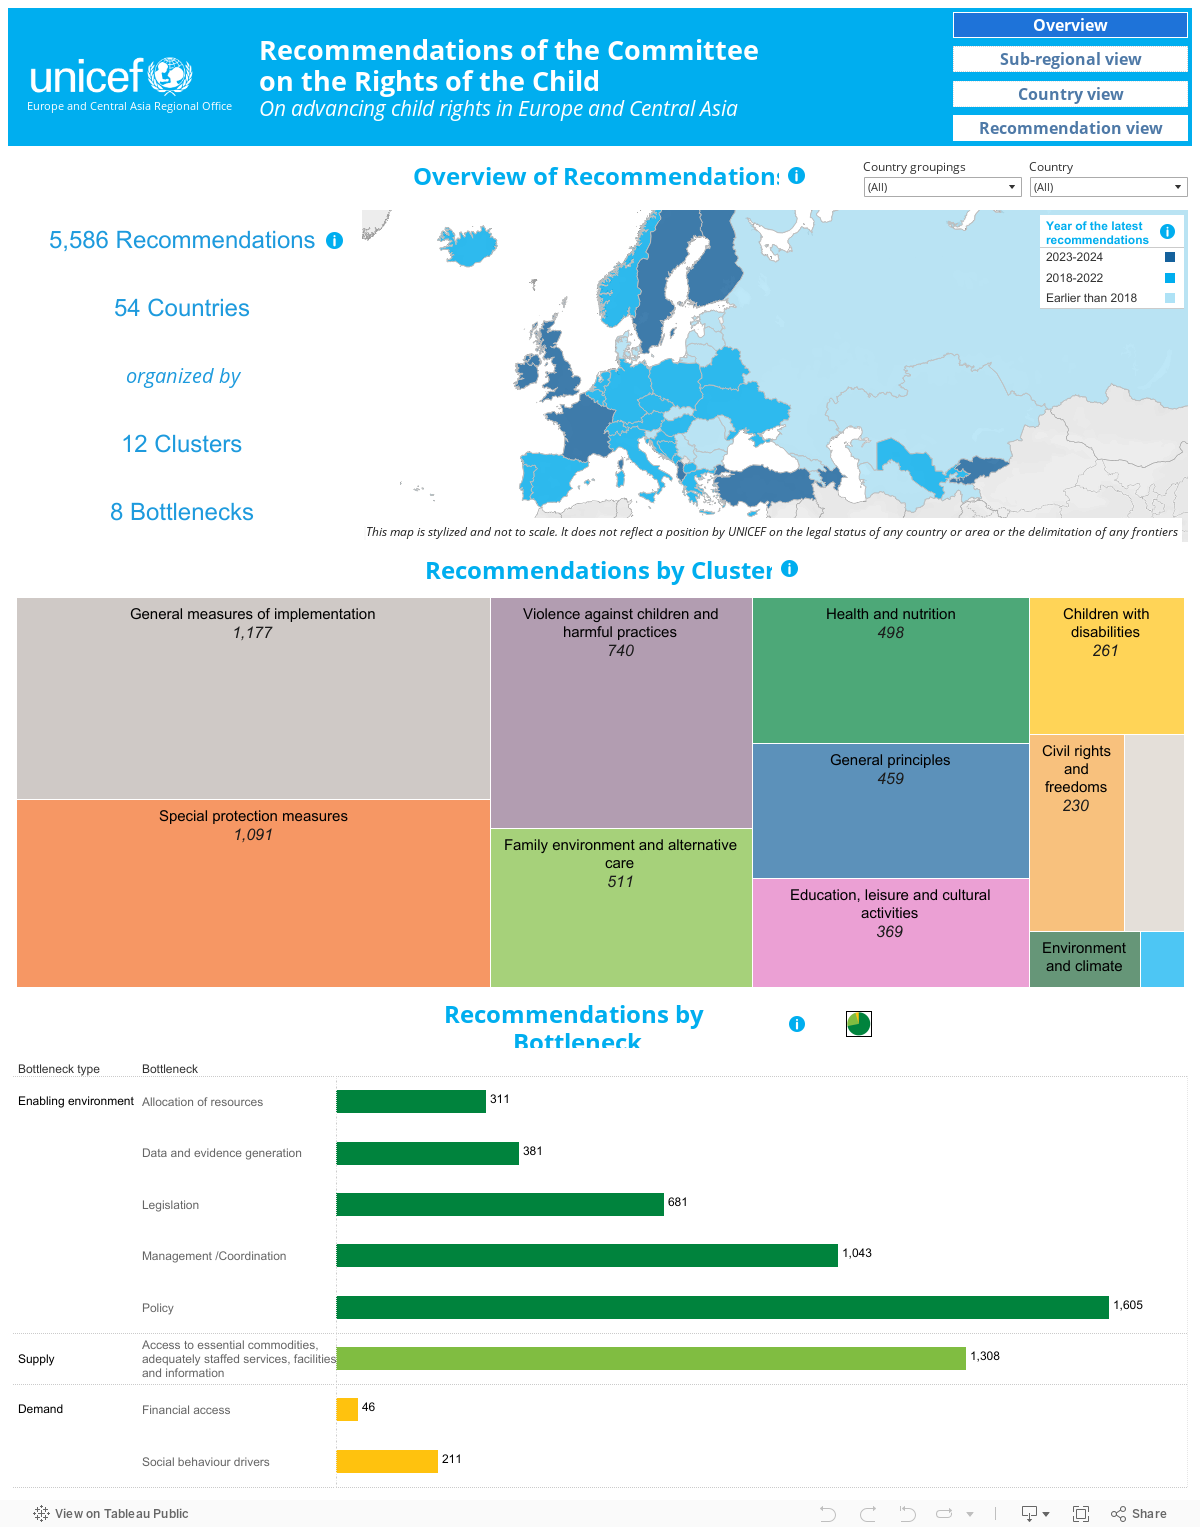
Overview
The ‘Overview’ page includes a visual representation of the ECA countries using a map of the region, a tree map chart based on the Themes Framework and a horizontal bar chart based on the Modified Determinant Framework, which are automatically updated based on the filtering options chosen on the map. The map allows filtering per country, i.e., selection of one or multiple countries, as well as filtering by groups of countries - UNICEF programme, UNICEF non-programme countries, EU members and EFTA countries. In addition, the filter in the upper right corner of the map facilitates filtering of the recommendations depending on the year in which they have been issued – the last two years, 3-6 years ago or earlier.
The recommendations in the tree map chart are presented at a theme level, while a more detailed presentation at a sub-theme level is possible by clicking on the theme of interest. The number of recommendations for each country shown in the hover text on the map and the recommendations shown in bar chart will also be filtered by the theme selected. The recommendations in the bar chart are presented both at a bottleneck type and bottleneck level. The recommendations shown in the other visualizations can be filtered by selecting a bottleneck or bottleneck type. A description of each bottleneck can be obtained by hovering over the bar for that bottleneck. After selecting a filter, access to the full text of the filtered recommendations can be found by hovering over the filter (the country or the name of theme/bottleneck/bottleneck type) and clicking on the link called ‘Go to Recommendation Details’. This feature will only work with one filter at a time. A filter can be removed by clicking on the selected filter again.
Sub-regional view
The ‘Sub-regional view’ page shows a map of the ECA region and includes three different kinds of charts that show recommendations grouped by sub-regions. Each country is assigned a colour code according to the colour scheme of the sub-region: Western Europe, Western Balkans, Eastern Europe, Caucasus and Central Asia. The country classification filter allows filtering by groups of countries - UNICEF programme, UNICEF non-programme countries, EU members and EFTA countries. The visualizations on this page can also be filtered by clicking on an individual country or multiple countries in the map or the scatter plot. The bar charts on the left of the map show the total number of recommendations by sub-region, as well as the average number of recommendations per country for the sub-region. If a filter is being used, only data for the selected countries will be shown.
In the scatter plot below the bar charts, each coloured circle represents a single country, and the x-axis shows the number of recommendations that the country has received.
The heatmap chart at the bottom of the page aggregates the number of recommendations either by theme or by bottleneck for each sub-region. The colours of heatmap can be based on the average number of recommendations per country in that sub-region or the total number of recommendations for the sub-region. Darker blues show higher values. Like the bar charts, only data for the selected countries will be shown in the heatmap if a filter has been applied.
Country view
The ‘Country view’ page allows comparison of the recommendations for up to 5 countries.
The bar charts display the number of recommendations at a theme level per country, while a more detailed presentation at a sub-theme level is possible by clicking on the theme of interest and choosing the option ‘Break into sub-themes’. Hovering over a bar shows trend data on the number of recommendations throughout the years for that country - this is applicable only when there are recommendations available for two or more reporting cycles.
The heatmap chart aggregates the number of recommendations by bottleneck for each selected country. Darker blues show higher values.
Access to the full text of relevant recommendations can be found by selecting the name of a country/theme/bottleneck or a chart value and clicking on the link called ‘Go to Recommendation Details’ in the hover text. The link will not show in the hover text unless the name or value has been clicked on.
Recommendation view
The ‘Recommendation view’ page displays the full text of the recommendations selected based on the following filtering options: ‘Country’, ‘Bottleneck type’, ‘Bottleneck’, ‘CRC theme’ and ‘Sub-theme’. And users can choose to see only the latest recommendations for each country (i.e., if a country has recommendations available for more than one reporting cycle, only the recommendations from the latest reporting cycle will be shown). This page also facilitates a text search option, allowing users to further narrow down the list of recommendations by including only recommendations that contain a keyword of their choice. A PDF of the list of the recommendations shown in the table can be downloaded by the clicking on the ‘Download PDF’ button. Before doing so, users can hover over the information icon to read how to change the settings to print all the recommendations in the list, rather than just the recommendations that can be seen in the table window at one time.